Make every transaction a strategic decision
Know exactly what’s selling, where, and to whom, before your competitors do. Harris Vision builds AI-powered retail analytics dashboards that bring POS, e-commerce, inventory, and supply chain data into one clear view, so your team can act faster, price smarter, and protect margin.
Track sales by channel, region, and SKU in real time
What is happening right now, and which store needs attention first?
Forecast inventory needs with 95% accuracy
How much stock should you hold before the weekend spike lands?
Segment customers using AI-driven behaviour models
Which shoppers are loyal, which are at risk, and which are ready to buy again?
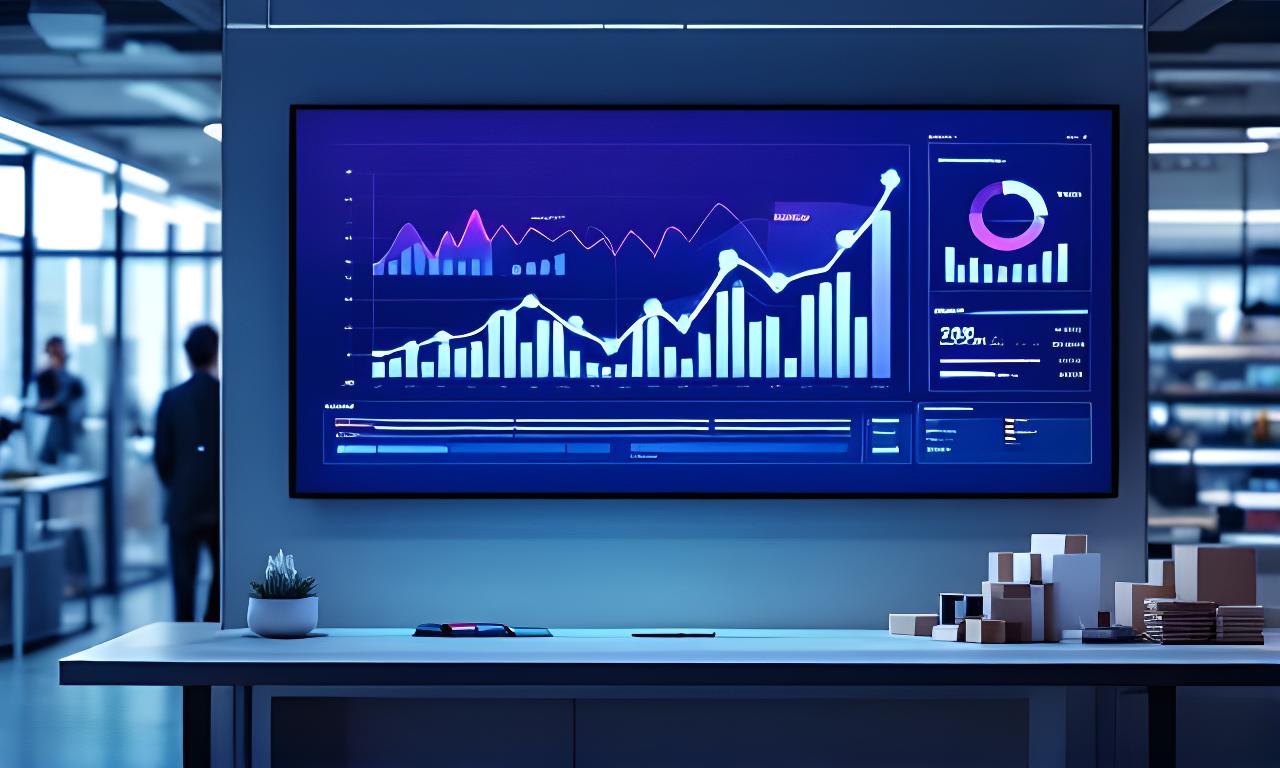
Everything you need to run a leaner retail operation
Daily sales trends, footfall versus revenue, basket size analysis, promotion effectiveness, returns rate, and inventory turnover all sit side by side. Why jump between spreadsheets when one dashboard can show the pattern for you?
A dashboard that tells the story, not just the numbers
Each line moves with the trading day. Open at 8:00, watch the picture by lunch, and adjust before close if the data demands it.
Daily sales trends
Channel-by-channel movementFootfall versus revenue
See conversion, not just trafficWhich city centre store is outperforming, and which one needs a sharper promotion plan?
Basket analysis
Spot the products that travel together, then design bundles that lift average order value.
Promotion effectiveness
See which offer pulled demand forward and which one simply discounted margin.
Inventory turnover
Keep best-sellers moving and catch slow stock before it quietly eats cash flow.
Understand your customers like never before
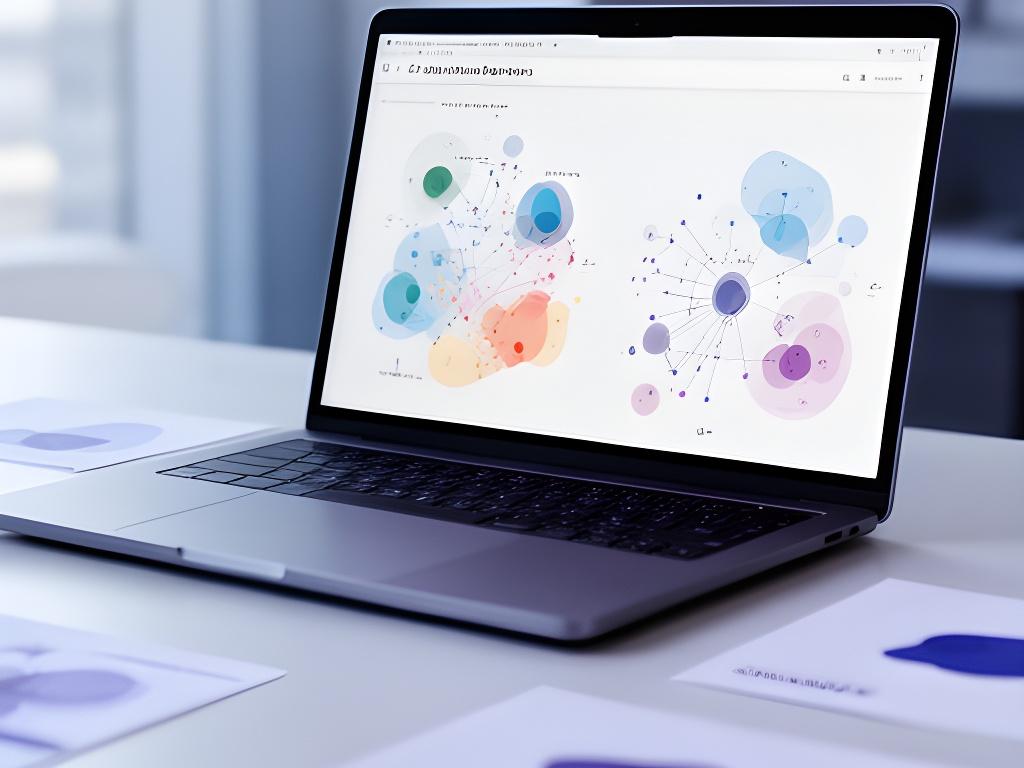
Our AI clustering builds dynamic segments such as loyal, at-risk, occasional, and VIP using recency, frequency, and monetary value. You’ll stop guessing who deserves a campaign, because the model keeps telling you who is most likely to respond.
Dynamic segments that move with real behaviour
Why keep static lists when shopper behaviour changes every week? The dashboard updates automatically as purchase patterns shift.
Campaigns built for response, not noise
A targeted fashion campaign lifted ROI by 34% for one UK retailer. What could the same logic do for your repeat customers?
Privacy-aware customer insight
GDPR-compliant analytics keep shopper privacy protected while still revealing useful commercial patterns.
Stop overstocking and stockouts with AI inventory analytics
Predictive models combine historical sales, seasonality, weather, events, and supplier behaviour to suggest the right reorder point. Isn’t it better when the system nudges you before the shelf goes empty or the warehouse fills with slow movers?
Inventory health by warehouse
Heatmap-style visibility, without the clutter.
Supplier signals
Lead times and order fill rates are watched continuously. When a supplier drifts, the dashboard surfaces it early.
Warehouse stock
You can compare warehouse health at a glance and decide where to rebalance before demand spikes.
Store replenishment
Low-stock alerts reach the right team quickly, so display space stays productive and customer-facing.
Customer demand
Seasonal patterns and external events shape forecast suggestions before a shortage becomes a service problem.
End-to-end supply chain visibility
From supplier to warehouse to store to customer, every milestone sits on one clean timeline. Delays, lead time variance, delivery performance, and cost per mile become visible in seconds, so your team can ask the right question immediately: what changed?
Supplier
API-fed updates reveal lead time swings, late dispatches, and upstream risk.
Warehouse
Inventory moves in and out with clear visibility over pick rates and inbound timing.
Store
Store teams see replenishment priorities and sales pressure in one place.
Customer
The journey ends with the shopper, where delivery quality and return patterns close the loop.
Trusted by growing UK retailers
The dashboard gave us the confidence to open two new locations – we could finally see the data behind our hunches. Why guess when the numbers can tell you what to do next?

Let’s tailor a dashboard for your retail business
Schedule a personalised walkthrough of our retail analytics suite. We’ll show you the live sales picture, the customer segments that matter, and the stock alerts your team can act on quickly. Response within one business day.
Talk to a retail analytics specialist
Prefer a quick conversation first? That works for us. We’ll help you decide which dashboard features will pay back fastest, and we’ll keep the next step simple.
-
AddressIslip Street, London, NW5 2DL, United Kingdom
-
Phone+447777872761
-
Email
A practical next step
Tell us what you sell, where you sell it, and what’s hurting margin. We’ll shape a dashboard around the numbers that matter most.