Automated financial reporting for ambitious firms

From spreadsheet chaos to boardroom clarity

Close the books faster and forecast with confidence from one dashboard. Why let month-end reporting drain your team when AI can surface cash position, margin trends, and client-level KPIs in seconds?

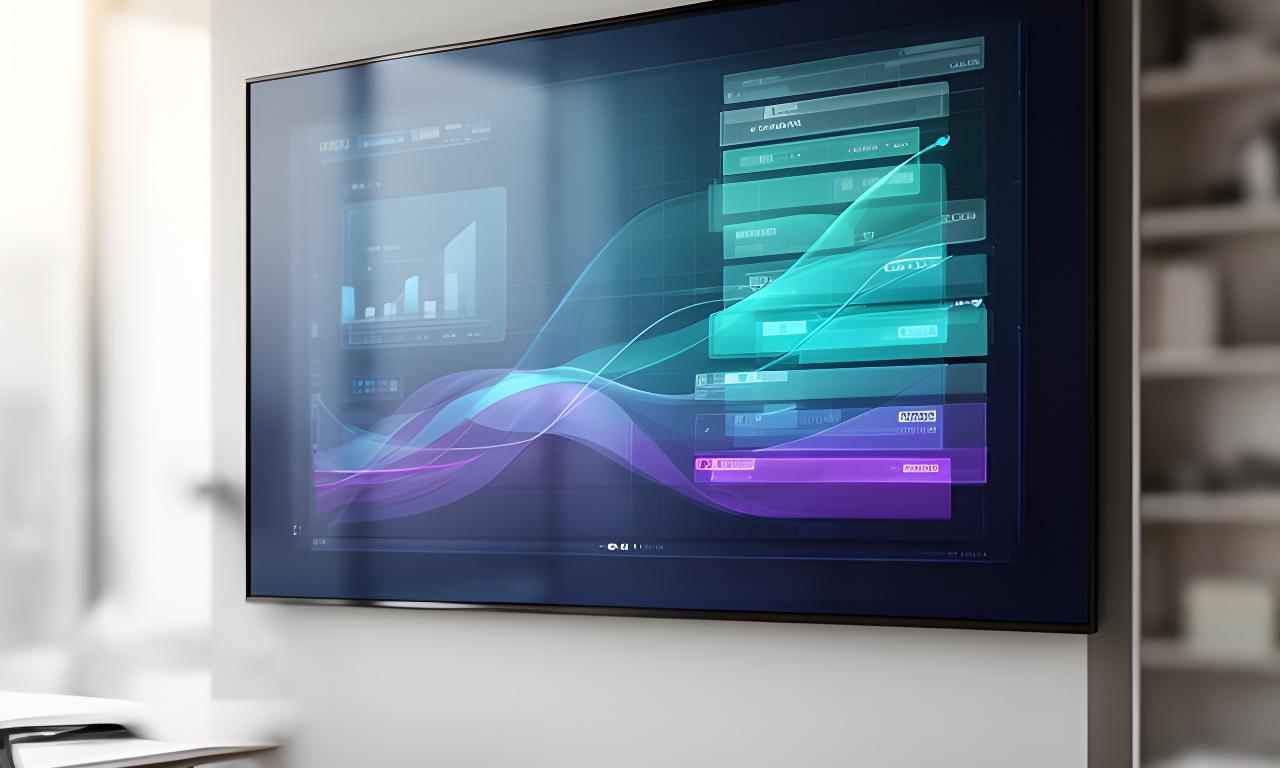
Elegant financial dashboard displayed on a large monitor in a modern London office with cash flow graphs and P and L summaries
SOC 2 compliant Reduce close from days to hours

Join 50+ UK accounting teams already automated.

What would you do with 120 hours back each month? Most firms start with one branded dashboard and never go back to static spreadsheets.

Everything you need to report with confidence

Automated report building, predictive forecasting, real-time KPI tracking, and board-ready exports sit side by side. That means fewer late nights, fewer manual reconciliations, and far less rework. Sounds better already, doesn’t it?

Built for firms that need answers now

Pull live data from Xero, QuickBooks, Sage, or core banking systems and keep every report in sync.

Automated report builder

Build P&L, balance sheet, and client packs with drag-and-drop components. Need a new view for a partner meeting? Create it once, reuse it forever.

  • Design branded monthly reports without wrestling with templates.
  • Standardise outputs across every client and every engagement team.
  • Export board-ready PDFs that look polished on day one.
Predictive forecasting

Our models project revenue and cash flow with up to 96% accuracy. What could that change for your planning cycle?

Ask in plain English

Type a question, get a chart. No SQL, no waiting, no back-and-forth with analysts.

Real-time KPIs

Traffic-light indicators show the numbers that need attention before they become a problem.

Board-ready exports

Send secure PDFs and shareable views that directors can read in a meeting, not after it.

Ask questions, get answers

Imagine a partner asking, “What is our cash position next quarter?” and seeing an instant answer. That’s the point. It shortens meetings, speeds up decision-making, and makes your analysts look very, very good.

96%

Forecast accuracy in modelled scenarios

Suggested queries

Show profit margin per client last quarter What changed in cash flow this month? Which accounts are trending off plan?
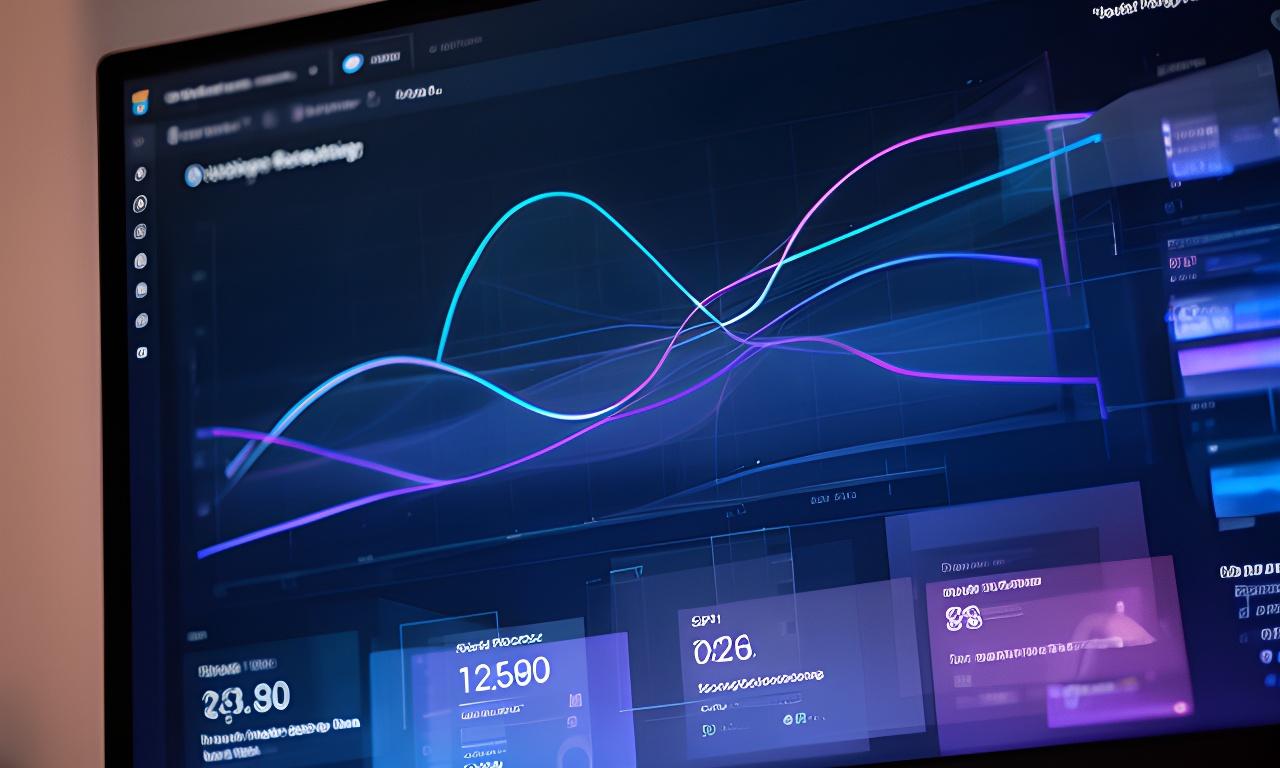
Close-up of an analytics screen showing forecast curves, KPI tiles, and a board meeting chart preview on a desktop dashboard
Demo preview

Instant response from a plain English question

The chart updates without a spreadsheet export. Would your team save time with that every week?

+15%

Retention uplift in a small London practice

120h

Saved per month after automation

24/7

Live dashboard access for every stakeholder

How a small London accountancy firm saved 120 hours a month

They were buried in Excel files, chasing client numbers and reformatting reports by hand. We replaced the manual workflow with automated monthly dashboards and branded PDFs. The result? Faster close cycles, clearer advisory meetings, and fewer errors slipping through at the end of the month.

40

Clients supported

120

Hours saved monthly

15%

Retention improvement

The forecasting module made our advisory meetings 10 times more compelling.

Clients understand the story instantly when the numbers are visual. Why spend time explaining a table when a clean dashboard does the job for you?

Managing partner speaking during a boardroom review beside a financial dashboard on a wall screen

Claire H. — Managing Partner

A private practice in central London

Request a sample build in three days

Give us the essentials, and we’ll build a sample client dashboard with your data, with consent, so your team can see the shape of the solution before committing. Why wait to visualise the savings?

Build progress 62%